Virtual Activity: Motion Graphs
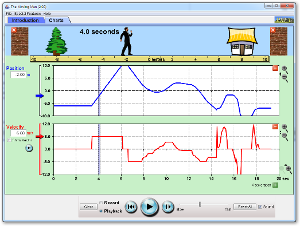
In this activity you will control the motion of a person as he moves along a street. Graphical analysis of his motion will be displayed as you slide the character around at various rates. Make sure you choose the "charts" tab at the top of the simulation to see the motion graphs. The motions you produce are recorded and can be replayed while you watch the graphs re-form.
Your goal in this activity is to gain an appreciation of how the graphical represenation of motion corresponds with the visual perception of that motion. With that goal in mind try the following:
1. In your notebook, create x-t and v-t graphs of a person running down the street at a constant speed. Now attempt to reproduce the graphs in the simulation.
2. In your notebook, create x-t and v-t graphs of a person walking backward down the street at a constant speed, stopping for a few seconds, then running with increasing speed forward. Now attempt to reproduce the graphs in the simulation.
3. Create your own scenario, graph it and then attempt to reproduce it in the simulation.
Click here to run the simulation in a web browser.